by Frank Schroth
Among the topics discussed at the September 2nd meeting of the School Committee were the most recent MCAS results (families should be receiving them this week) and the new process for evaluating the Superintendent which is also the model that will be used for teachers.
Asst Superintendent John Phelan presented the MCAS results along Math & ELA coordinators Holly Concannon (Cunningha/Collicot) and Amy Gale (Pierce), and Courtney Walsh, Math, Business & Technology Dept head at Milton High. The presentation opened with an explanation of how accountability is measured and it borders on mind numbing in its acronyms and jargon. Core PPI indicators include the CPI for ELA achievement, median SGP for Mathematics and the cohort graduation rate. PPI stands for Progress & Performance Index. It is the key metric and it factors in achievement, growth, graduation rate, and drop out rate. (NOTE: the last two metrics are for the high school only.
All school receive a level classification. They are classified level 1 if their aggregate cumulative score is above 75, the high needs subgroup is above 75 and their is a participation rate of 95% or higher. If they do not achieve any of those then the school is rated at level 2. If any school in a district is rated level 2, then the district as a whole is rated at level 2. In Milton Cunningham and Pierce were rated level 2 schools. Tucker, Clover, Collicot, and Milton High were rated level 1.As Mr. Phelan noted the line between a school classified as level 1 and one classified at level 2 can be a very fine one. It only takes a couple of absences on the day the MCAS is administered to bring the participation rate below 95%. No matter how well a school does in other metrics it will be classified as level 2. Special consideration is given but there needs to be substantial cause.
Overall the achievement levels for ELA (English Language) and Math have remained consistent over the last 4 years. Science has improved. Here are the total pecentages of students district wide whose test results were”Proficient” or “Advanced” (the other two categories are “Needs Improvement” and “Warning/Failing.”
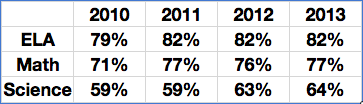
Please note – These are top line figures. There is much more data in Mr. Phelan’s presentation which one will be able to review when the presentation is posted to the MPS web page. It has not been posted as of this writing.
Collicot results were a high point. Collicot was “commended for high achievement – high progress – narrowing proficiency gaps.”
Where the results were not so good was in the area of high needs students, students with disabilities, and African American / Black which district wide failed to meet target. Cunningham failed to meet “High needs” target and the Pierce failed to meet “High needs” “low income” and “African American.”
Mr. Phelan noted that there had been recognition of an achievement gap last year. That understanding and need to address it was a major impetus to the budget the schools submitted last spring which specifically targeted the achievement gap, early learning and science.
Mr. Phelan’s presentation was an overview. School Site Councils will be providing more information and methods of addressing issues in their respective presentations. Member Walker felt the site councils should all present on the same night so as to share strategies etc. Phelan’s team of presenters also reviewed other steps that are being taken. One is more tartgeted assessment given more frequently to pinpoint specific areas of weakness for individual students and enable teachers to put special attention to address.
You can find the Milton School District MCAS Accountability report here. Note that there are links at the bottom of the page for individual schools. Lastly, there is an alternative to MCAS being developed. It is the Partnership for Assessment of Readiness for College and Careers (PARCC). Massachuestts is one of 19 states participating in the consortium to develop the assessment tools.
- Related article: New PARCC exams to focus on student readiness, may replace MCAS – Berkshire Eagle
At the meeting Superintendent Gormley presented the process for evaluating the . . . superintendent.
It is Department of Elementary and Secondary Education’s evaluation system and it parallels the process that will be used to evaluate teachers. It is a thorough process, which, not surprisingly, includes a rubric. The evaluation is actually an ongoing cycle of review that includes a self-assessment, analysis, goal setting and plan development, plan implementation, formative assessment, and summative evaluation.
The session also included but was not limited to a discussion of data points that the committee wants captured (e.g. graduation rates, test scores, club participation rates etc). There was consensus for the most part, but not the whole part. Member Walker wanted the committee to take a vote. Chair Sheridan wanted to wait for input from the Superintendent. Walker expressed some mild frustration saying, “It would be helpful to make a decision every now and then.” Sheridan and Walker also had a difference of opinion on how granular test results should be. Walker argued that the results should be by school, by grade and by classroom. Sheridan said “as an educator for many years I have a serious problem with [looking at data] class by class, teacher by teacher.” This was not discussed within the context of teacher evaluations. However, nationwide pupil performance as a factor in teacher evaluations is a much discussed and debated issue.
- related article: State pushing forward on new teacher evaluation process – 9/30 – Danbury News Times. Find more news results here.
Sheridan said it was “okay to go grade by grade but not by class.”
The committee will vote on the date collection requirements at their next meeting.